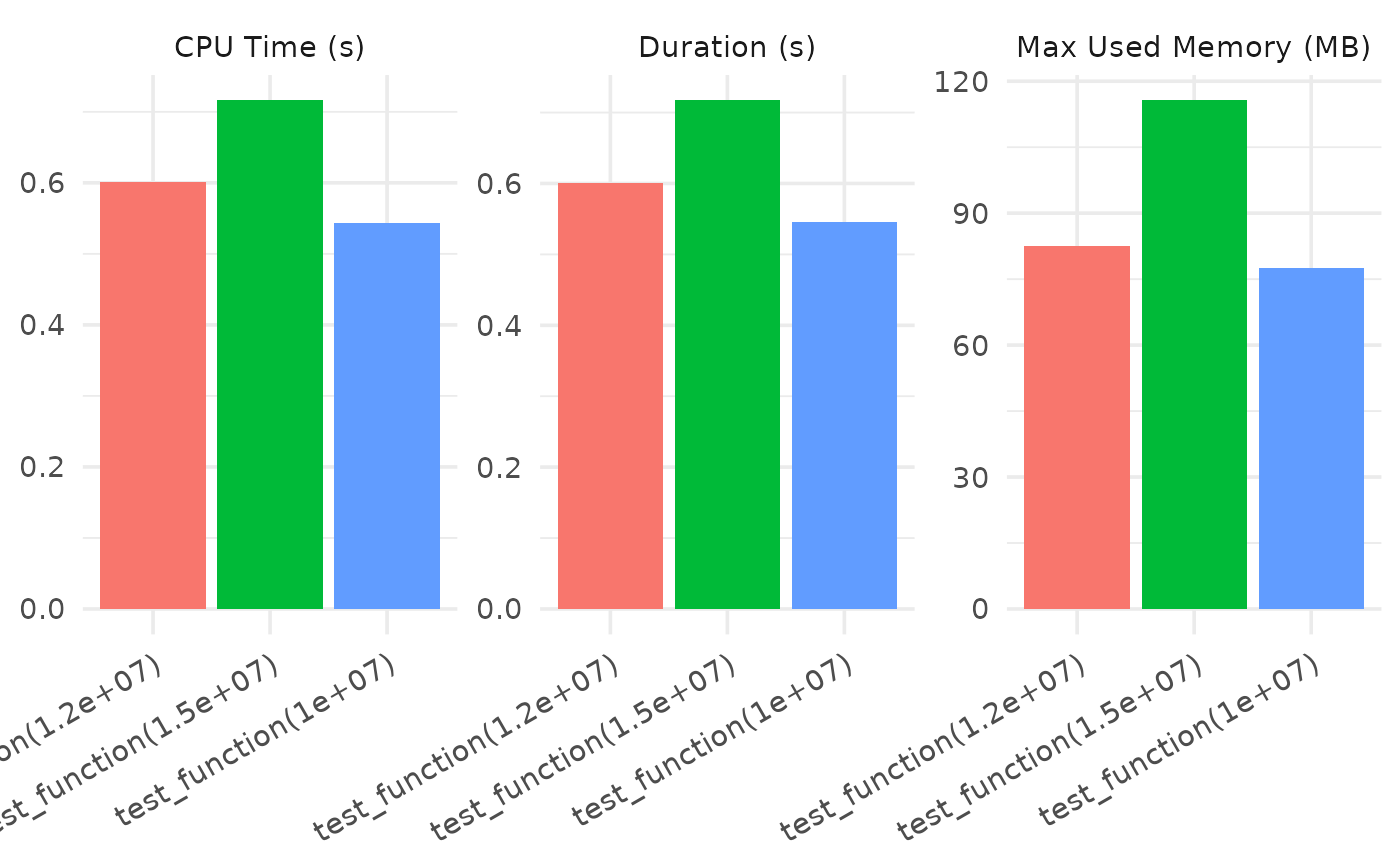
Autoplot method for timemoir results (grouped bar chart)
Arguments
- object
A result from timemoir()
- unit_memory
unit for memory display: "MB" or "GB" (default to "MB")
- ...
unused
- x
A
timemoirobject.- y
Ignored, required for compatibility with the
plot()generic.
Examples
test_function <- function(n) {
  x <- rnorm(n)
  mean(x)
}

res <- timemoir(test_function(1.2e7), test_function(1.5e7), test_function(1e7))
#>
#>
#>

if (require(ggplot2) && require(tidyr) && require(dplyr)) {
  plot(res)
}
#> Loading required package: ggplot2
#> Loading required package: tidyr
#> Loading required package: dplyr
#>
#> Attaching package: ‘dplyr’
#> The following objects are masked from ‘package:stats’:
#>
#>     filter, lag
#> The following objects are masked from ‘package:base’:
#>
#>     intersect, setdiff, setequal, union